Health Monitor helps you keep your Plesk installation running smoothly by keeping track of the system resources' usage on the server and notifying you when one or more resources' usage reaches a pre-defined threshold.
Health Monitor is an optional component and is not installed by default. You can install Health Monitor using the Plesk Installer. Look for the Server health monitor component.
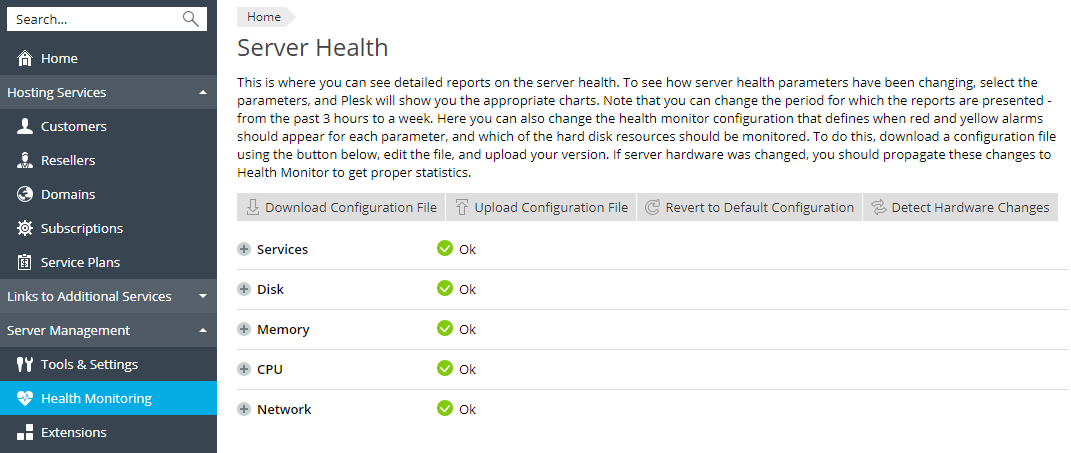
Server Health Monitor is located under Health Monitoring in the main left panel.
In Service Provider view, Server Health Monitor is also displayed on the Home page under Server Health.
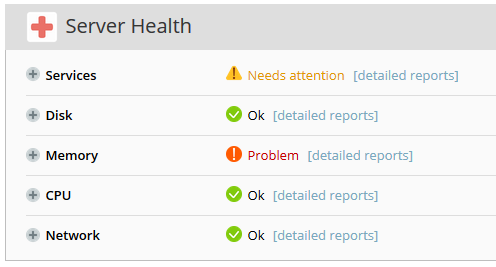
The resources and services monitored by Health Monitor are separated into five broad categories. If the usage of at least one resource or service within a category exceeds one of the pre-configured thresholds, a corresponding warning is displayed. For each resource or service, two thresholds can be configured: a "yellow" one, and a "red" one. Resource usage exceeding the yellow threshold indicates high load that is potentially problematic. Resource usage exceeding the red threshold indicates a situation that can potentially affect the operation of Plesk and its services, demanding an immediate response. By default, Health Monitor comes pre-configured with optimal settings for each resource and service. However, these settings can be changed by the administrator.
To see more detailed information about the resource usage, expand the categories.
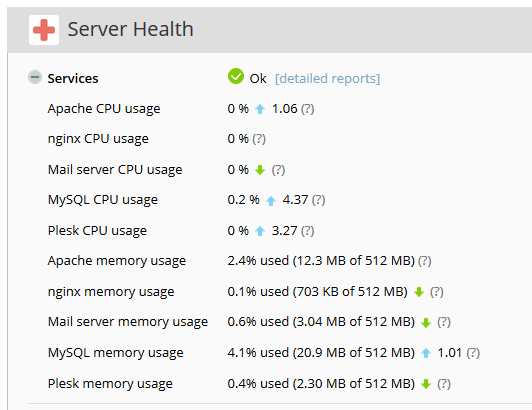
Expanding a category displays the current resource usage for all resources and services included in the category, as well as the resource usage trends. The ![]() icon indicates that the resource usage for a service or resource increased during the last hour, and the
icon indicates that the resource usage for a service or resource increased during the last hour, and the ![]() icon indicates that the resource usage decreased during the last hour. The number displayed to the right of the trend icon shows by how much the resource usage increased or decreased during the last hour. For example, if the value of the number is 1.87, it means that during the last hour the usage of that particular resource or service increased or decreased by the factor of 1.87, depending on the trend icon. If the increase or decrease in usage is insignificant, the exact value is not shown.
icon indicates that the resource usage decreased during the last hour. The number displayed to the right of the trend icon shows by how much the resource usage increased or decreased during the last hour. For example, if the value of the number is 1.87, it means that during the last hour the usage of that particular resource or service increased or decreased by the factor of 1.87, depending on the trend icon. If the increase or decrease in usage is insignificant, the exact value is not shown.
Note that Health Monitor shows instantaneous parameter values that are not updated in real time. This means that the values displayed in Health Monitor reflect the resource usage at the moment the page was loaded, and not the current resource usage. To view up-to-date resource usage values, refresh the page in your browser.
To see how resource usage changed over time, go to Server Management > Health Monitoring. Expand a category and select the checkboxes next to one or more resources or services to see a detailed resource usage graph for those resources or services, for a period ranging from three hours to one week.
By default, Health Monitor comes pre-configured with optimal settings for each resource and service. If you want to change the default settings, go to Server Management > Health Monitoring and click Download Configuration File to download the custom-health-config.xml configuration file. Edit the file according to the instructions contained within. You can change the following Health Monitor parameters:
Once you make the changes to the configuration file, save them and upload the file (Server Management > Health Monitoring > Upload Configuration File). The changes will take effect immediately.
The hardware configuration of your Plesk server is captured by Health Monitor during the component installation. Any changes made to the server hardware afterwards are not reflected in Health Monitor. For example, if you increase the amount of RAM from 1 GB to 2 GB, Health Monitor will still display that the total amount of RAM on the server is 1 GB. To make Health Monitor reflect the changes made to the server hardware, go to Server Management > Health Monitoring and click Detect Hardware Changes.