Viewing Statistics
To view the information on usage of server resources:
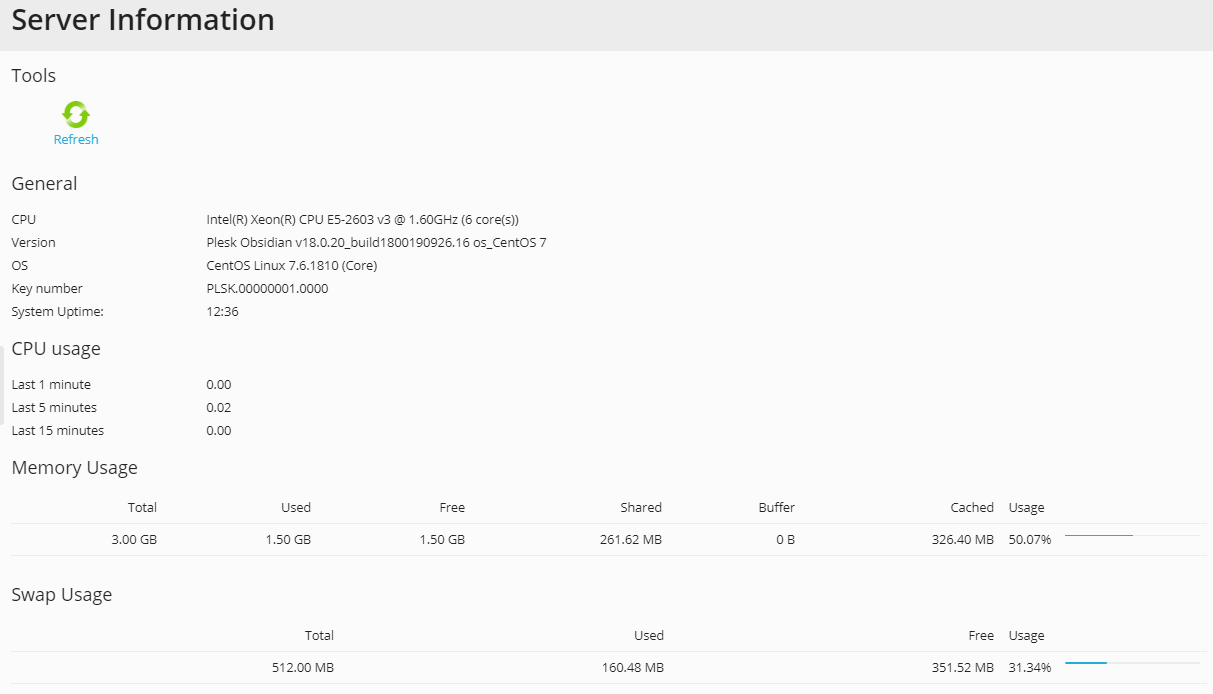
Go to Tools & Settings > Server Information.
The following information will be presented:
- Processor information.
- Plesk version and build number.
- Operating system and its kernel version.
- Plesk license key number.
- Server uptime.
- Processor load averages for the last 1 minute, 5 minutes and 15 minutes.
- The amount of RAM installed and used.
- The amount of swap space used.
- Hard disk usage by partitions and directories.
- The connected (mounted) storage and network storage devices.
- The number of hosted domains: active shows the domains that are online; problem shows the domains that have exceeded the disk space and bandwidth allotments but still online; passive shows the domains that are offline because they were suspended by you or your resellers.
Click Refresh to update the server statistics with the latest data.
To view a report on resource usage by your resellers, customers, and websites:
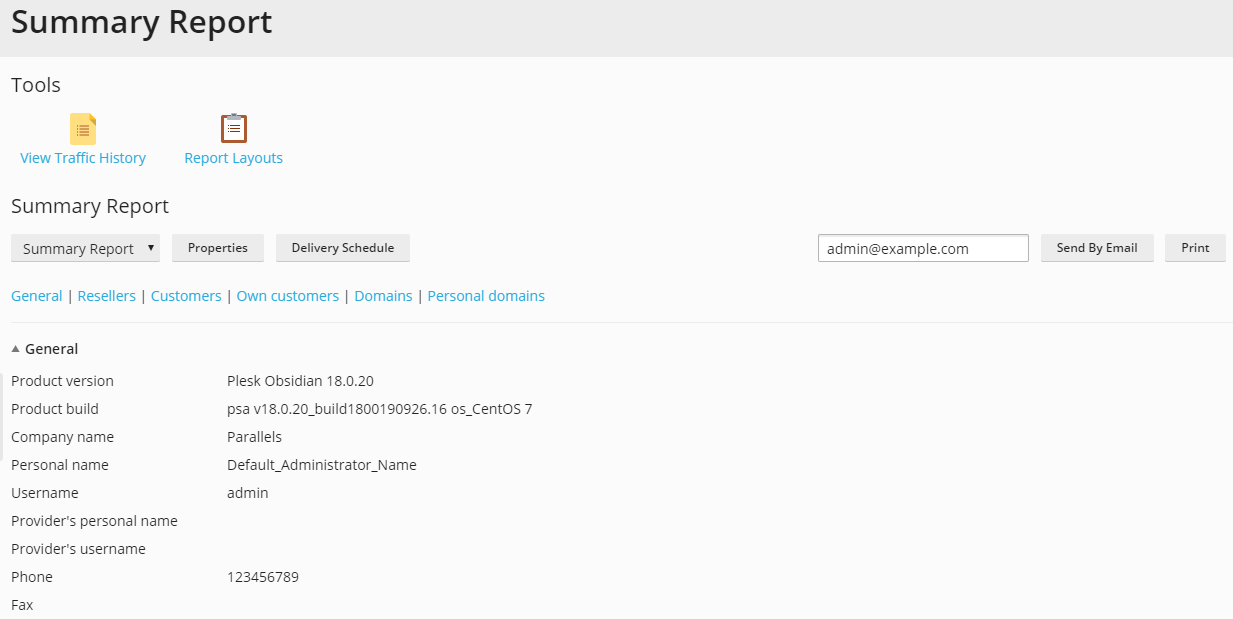
- Go to Tools & Settings > Summary Report.
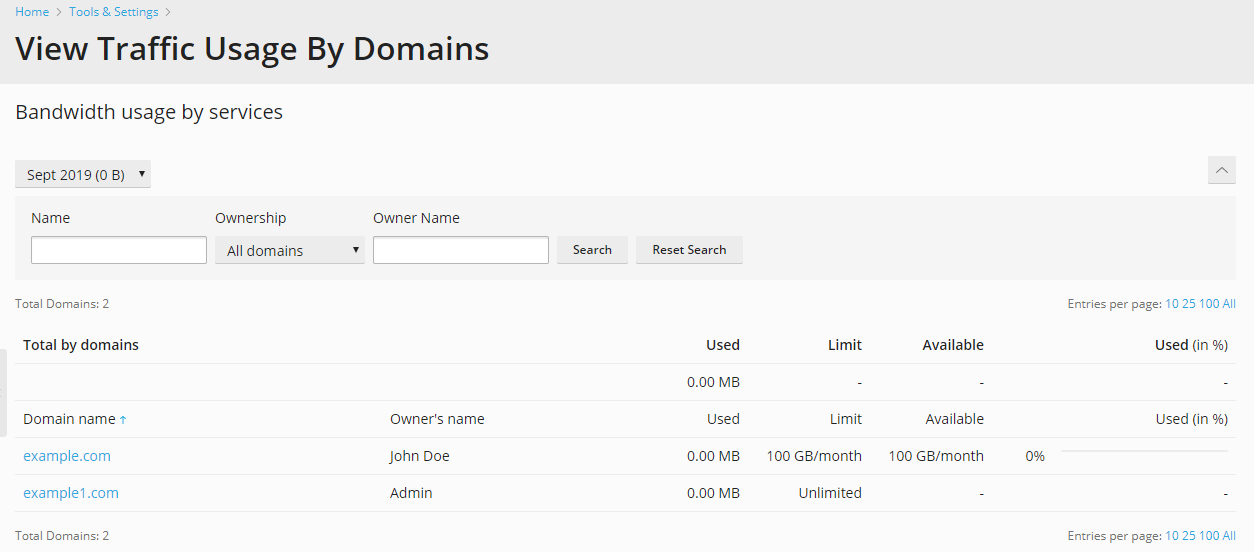
- To view a summary on bandwidth usage by months, click View Traffic History.
Operations on reports:
To get more details, select the Full Report option from the drop-down menu.
To adjust the amount of information presented in a report, edit an existing report template or create a new one. To edit a template, click Properties, and then modify the report template.
To create a template, go to Report Layouts > Create Report Layout, and specify how much information you want in each section of the report: select None if you do not want any information, select Summary if you want a concise overview, or select Full, if you need a detailed report. Select the Use as default report checkbox and click OK.
To delete a custom report layout, select the checkbox corresponding to the report layout name and click Remove.
To print the report, click Print. A report will open in a separate browser window. Select the File > Print option from the browser’s menu to print the report.
To send the report by email, click Send by Email. By default, the administrator’s email address is used, but you can type in a different one in the corresponding field.
To have the reports automatically generated and delivered by email on a daily, weekly, or monthly basis, click Delivery Schedule and follow the instructions supplied in the section Automating Report Generation and Delivery by Email.
To view a report on traffic usage by users and sites:
Click Tools & Settings.
Do any of the following:
To view reports on the amount of traffic used by resellers, click Traffic Usage By Resellers (in the Statistics group).
To view reports on the amount of traffic used by customers, click Traffic Usage By Customers (in the Statistics group).
To view reports on the amount of traffic used by domains (websites), click Traffic Usage By Domains (in the Statistics group).