Advanced Monitoring
Advanced Monitoring helps you keep your Plesk running smoothly by tracking the server resources usage and notifying you when one or more resources usage reaches a pre-defined threshold.
Advanced Monitoring works in tandem with the Grafana extension and uses Grafana to display server metrics as graphs and dashboards. The Advanced Monitoring and Grafana extensions are installed in Plesk Obsidian by default.
Note
If you upgraded to Plesk Obsidian from Plesk Onyx and had Server Health Monitor installed, Advanced Monitoring will be automatically installed and will replace Server Health Monitor.
Tracking Advanced Monitoring Graphs
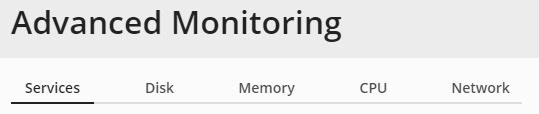
Advanced Monitoring is located in the main left panel. The resources and services monitored by Advanced Monitoring are separated into five categories, each one is shown on its own tab.
The values displayed in Advanced Monitoring
reflect the resource usage at the moment the page was loaded and not the current resource usage.
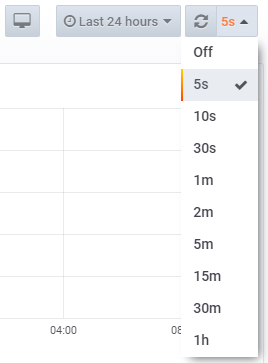
You can select how often Advanced Monitoring will auto-refresh its data
(for example, each five seconds or each hour)
or you can turn off auto-refresh and refresh the data manually by clicking the  icon.
By default, Advanced Monitoring auto-refreshes its data every two minutes.
icon.
By default, Advanced Monitoring auto-refreshes its data every two minutes.
Note
Advanced Monitoring data does not change in real time. If your server is permanently loaded, you will not see the conformity between Advanced Monitoring and a system resource usage monitor (for example, top in Linux or Task Manager in Windows).
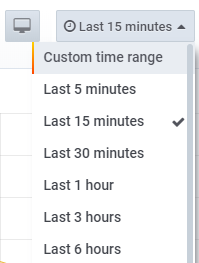
You can also select a time period for which Advanced Monitoring will generate graphs or specify a custom time period by selecting “Custom time range”. This may help you find out how the parameters change with time and identify the time periods when the resources usage is maximal or minimal.
Note
Any changes you make in Advanced Monitoring dashboards will not be saved. For example, if you select the “Last 6 hours” time range and turn off auto-refresh, Advanced Monitoring will return to its default settings once the browser page is refreshed.
Tracking Advanced Monitoring Notifications
You can track server health not by only looking at resources graphs but also by paying attention to Advanced Monitoring notifications.
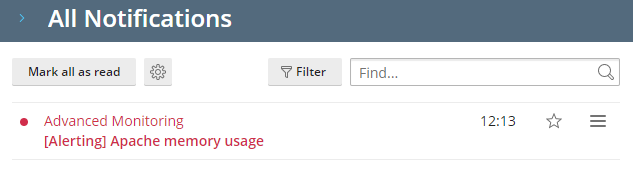
Advanced Monitoring shows notifications in the Plesk interface when the resource usage exceeds its threshold and/or returns to its normal value. The notifications are shown not for all resources but only for those that are turned on and have their thresholds set in Advanced Monitoring settings.
Certain resources already have their notifications turned on and their thresholds set by default. When a default threshold is exceeded, it means that a parameter is close to its critical value and this high load can be potentially problematic.
If you do not have experience in server administration, we recommend that you keep the default Advanced Monitoring configuration. The pre-configured thresholds and enabled notifications are optimal. Otherwise, you can set your own thresholds and turn on and off notifications for particular resources.
To set custom thresholds and/or turn on and off notifications for particular resources:
Go to Advanced Monitoring and click Settings.
Here you can:
- Turn on and off notifications for particular resources.
- Customize a threshold.
You can customize a threshold only for a resource that is turned on. If necessary, turn it on and then set the threshold. Certain resources can have two thresholds: the absolute one (in units of measurement) and the relative one (in percent). In this case, choose the preferred threshold first and then set its value.
Click Apply to save settings and then click Back to statistics to return to the main screen of Advanced Monitoring.
You can also turn off all Advanced monitoring notifications for all resources.
To turn off notifications for all resources:
- Click the
 icon in the upper right corner of the screen and then click the
  icon.
icon. - Here you can turn on notifications that inform when the resource usage:
- Exceeds its threshold.
- Returns to its normal value.
Updating Advanced Monitoring After Hardware Change
The hardware configuration of your Plesk server is captured by Advanced Monitoring during the extension installation. Any changes made to the server hardware afterwards are not reflected in Advanced Monitoring. For example, if you increase the amount of RAM from 1 GB to 2 GB, Advanced Monitoring will still display that the total amount of RAM on the server is 1 GB. To make Advanced Monitoring reflect the changes made to the server hardware, go to Extensions > the “My Extensions” tab > Grafana, click Open, and then click Restart integration (in the “monitoring” row).