Monitoring System Services
Start or Stop Monitoring
To specify what services should be monitored and to start monitoring:
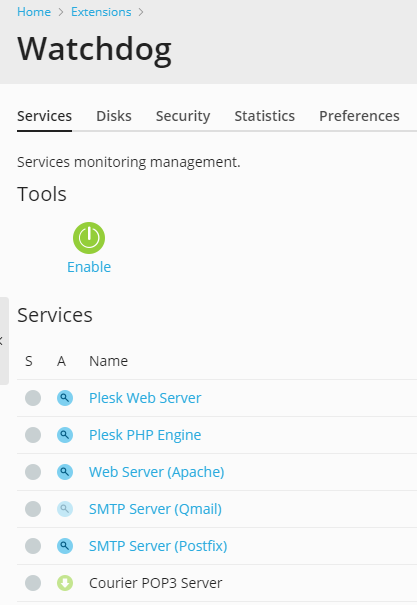
Go to Extensions > Watchdog.
All services controlled by Plesk will be listed on the Services tab.
Specify the services that should be monitored and specify monitoring preferences:
- Click a service name.
- Select the Monitor the service checkbox to set the Watchdog to monitor the service.
- Select the Save service statistics checkbox if you wish Watchdog to keep the information on CPU and RAM resources used by the service, and present it in graphical reports (Extensions > Watchdog > Statistics).
- Select the Stop monitoring the service if it frequently restarts option, if you wish Watchdog to stop monitoring the service if it fails the specified number of times, and specify the failure ratio. Otherwise the Watchdog will bother you with alert messages each time it attempts to restart a non-responsive service. The default value of five failed attempts should be enough.
- Specify the time during which Watchdog will be waiting for response from the polled service in the Connection timeout box. Watchdog polls the service and then is waiting for response during the specified amount of time. If Watchdog receives no response, it restarts the service. If you host a great number of sites and email accounts on your machine, you are recommended to set the Connection timeout for Qmail mail server to 120 seconds, and Apache Web server to 15 seconds, otherwise Watchdog will consider the busy services to be malfunctioning and will restart them.
- Review the commands that Watchdog uses to start and stop the service. It is recommended that you leave the prefilled values unchanged. You can write custom scripts that, for example, will clean up log files or send an SMS to your cell phone before actually starting the service, and specify the commands to run your scripts in the To start the service, run the command and the To stop the service, run the command fields.
- If you are using the default commands for running the services, leave the predefined value of 60 seconds in the Service startup time box. If you are running custom scripts, and they take more than 60 seconds to execute, specify the required time in the Service startup time box. When a script is executed but does not complete its work within the specified time frame, Watchdog terminates execution of that script.
- Click OK to submit the settings.
- Repeat this procedure to configure monitoring for all services you
need. If you are satisfied with the default monitoring settings we
have predefined for each service, you can set Watchdog to monitor
the required services by simply clicking the respective
 icons in the A column in the list of
services.
icons in the A column in the list of
services.
Once you have specified all services you would like Watchdog to monitor, click the Enable icon in the Tools group.
Now the services will be monitored in accordance with the settings you specified. If you decided to use the default settings, the following actions will be taken:
- All services will be automatically restarted in case of failure.
- Watchdog will stop monitoring all services failing 5 times out of 5 polls.
- Alert messages will be sent to the email address specified in the Plesk administrator’s account on any event.
To stop monitoring a specific service:
- Go to Extensions > Watchdog.
- Click a
 icon corresponding to the service you would
like Watchdog to stop monitoring.
icon corresponding to the service you would
like Watchdog to stop monitoring.
To stop monitoring all services:
- Go to Extensions > Watchdog.
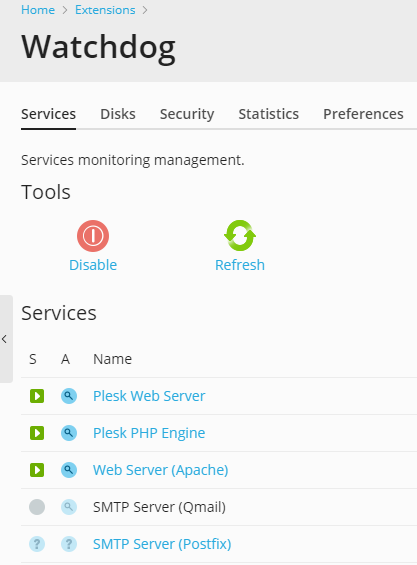
- Click the Disable icon in the Tools group.
Note
Performing this action affects the whole monitoring service, meaning that not only all system services, but all disk partitions will stop being monitored.
View Services Status
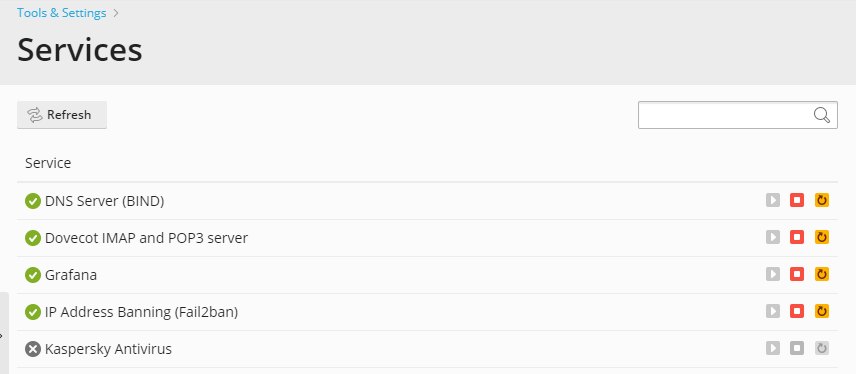
To view the status of Plesk-managed services:
Click Tools & Settings > Services Management. A list of Plesk services will be shown. From that screen you can manage services and view their status.
Or
Click Extensions > Watchdog. A list of Plesk services will be shown. From that screen you can view service statuses and manage monitoring preferences.
The following information is displayed:
An icon in the S (status) column shows whether a service is currently monitored by Watchdog and it indicates the status of a service returned by the last poll:
 - the service is not currently monitored.
 - you started monitoring but the service has not
yet been polled for its status.
- you started monitoring but the service has not
yet been polled for its status. - the service is monitored and Watchdog reports
that the service is running.
- the service is monitored and Watchdog reports
that the service is running. - the service is monitored and Watchdog reports
that the service is down.
- the service is monitored and Watchdog reports
that the service is down. - the service is no longer monitored by Watchdog
because this service was unstable.
- the service is no longer monitored by Watchdog
because this service was unstable.An icon in the A (Monitoring) column shows whether you set Watchdog to monitor the service and it also indicates whether the service was installed on the server and properly configured:
 - the service is not installed.
 - the service is not configured.
 - you did not set Watchdog to monitor the service.
 - you set Watchdog to monitor the service.